
Where US filing activity actually lands
Using the WIPO Statistical Database's origin-to-destination filing matrix for 2014 to 2024, this analysis looks at:
How US-origin applicants split their filing between home and abroad
How that balance has shifted over the decade
Where their outbound filings actually go
Who files into the US from abroad
It's part of a wider look at this same question across a dozen major filing nationalities, covered in full here, if you'd like the broader comparison alongside the US-specific detail below.
In 2024, US-origin applicants filed 554,773 trademark applications worldwide, and 192,922 of them, more than the total annual trademark filing volume of most individual countries, were filed abroad. The remaining 361,851 (65.2%) were filed only with the USPTO; the outbound share came in at 34.8%.
Put another way: for roughly every two applications a US applicant files at home, about one is filed abroad, a ratio of 0.53 international filings for every domestic one.
Are US applicants filing abroad more often, or less?
The table below tracks both the domestic share of total US-origin filing activity and the abroad-to-domestic ratio across the decade:
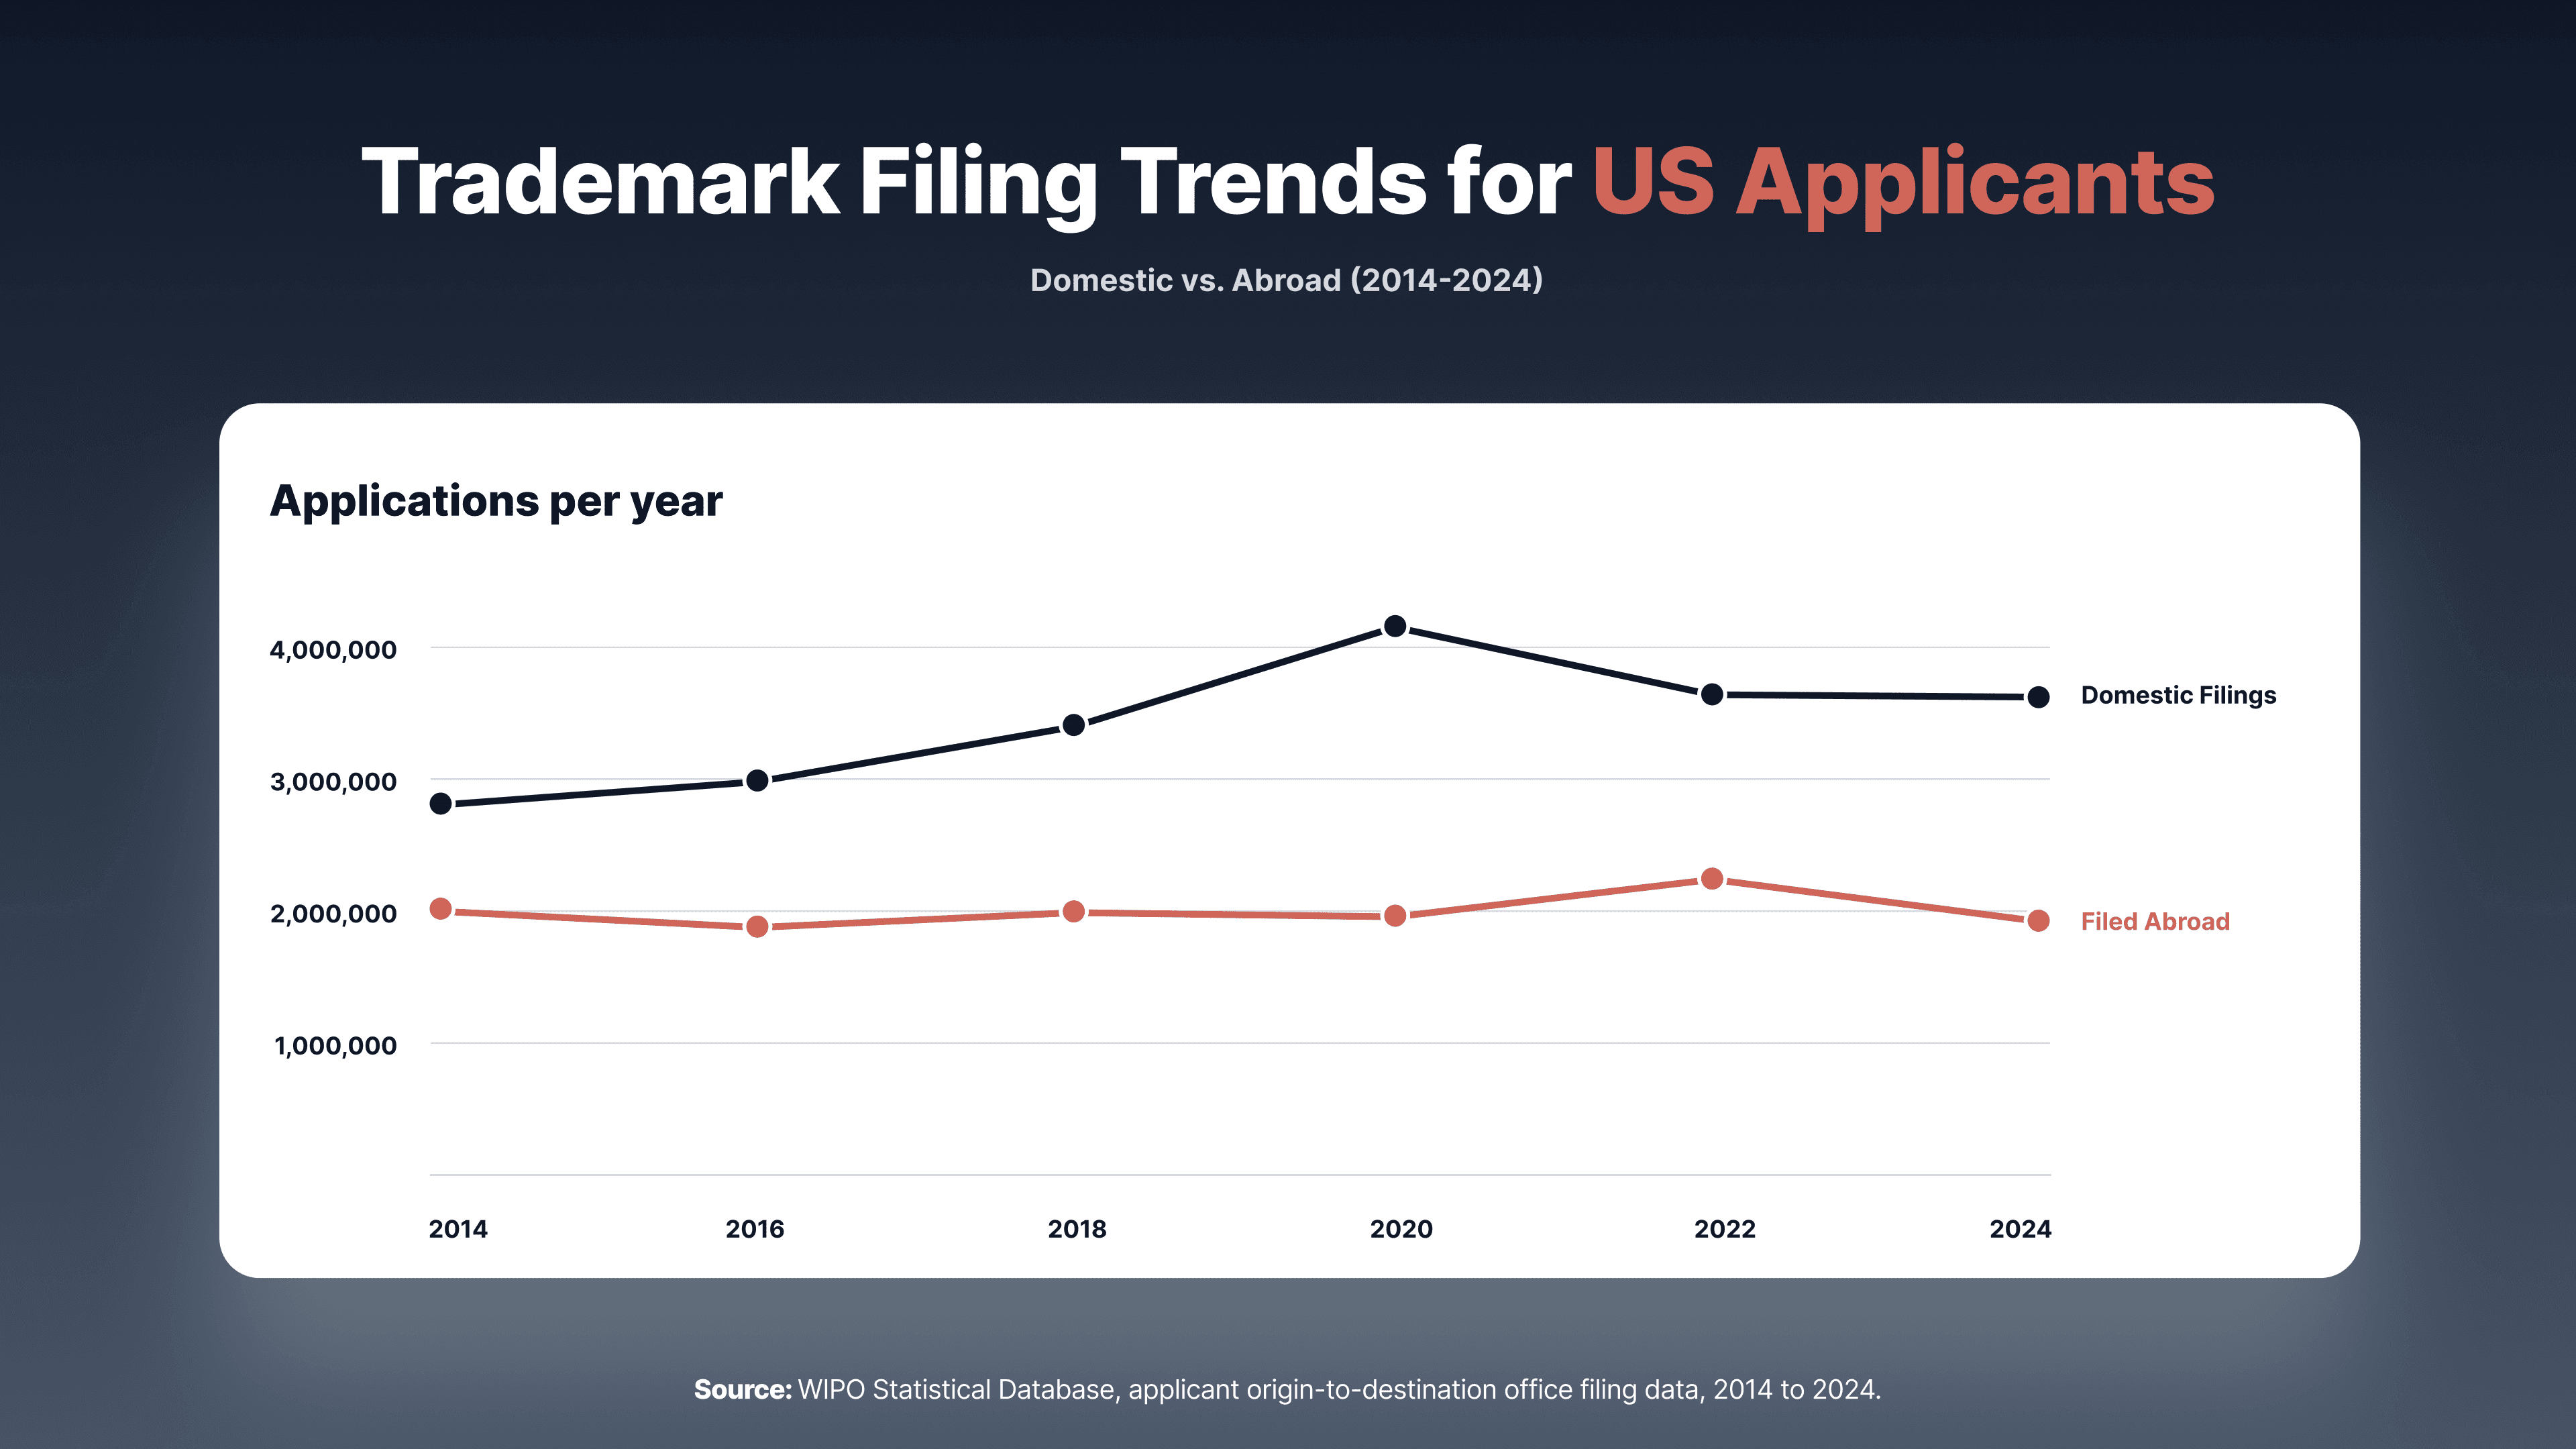
Source: WIPO Statistical Database, applicant origin-to-destination office filing data, 2014 to 2024.
Domestic share has risen from 58.2% to 65.2% over the decade, and the abroad-to-domestic ratio has fallen from 0.72 to 0.53. In practical terms, however, while US applicants have significantly grown their domestic filing volume, nearly 200,000 US-origin applications have gone abroad every single year of the decade, including 2024.
Where US applicants actually file abroad
Looking at 2024, the destinations receiving the largest volume of US-origin filings are concentrated in a short list of major economies and immediate neighbors:
Rank | Destination | US-Origin Applications (2024) |
|---|---|---|
1 | Canada | 17,870 |
2 | European Union (EUIPO) | 17,211 |
3 | Mexico | 15,884 |
4 | United Kingdom | 15,527 |
5 | Australia | 8,656 |
6 | Japan | 7,649 |
7 | Brazil | 7,606 |
8 | India | 6,634 |
9 | South Korea | 5,875 |
10 | China | 4,029 |
Canada, the EU, Mexico, and the UK together account for well over a third of all US outbound filings, unsurprising given geographic proximity, trade ties, and market size. Beyond that top four, volume drops off quickly, and the rest of the top ten is a mix of large economies.
Who files into the US from abroad
The US market itself draws a substantial amount of foreign filing activity. Of the 590,158 total applications filed with the USPTO in 2024, 228,307 (38.7%) came from applicants based outside the United States. The largest foreign filer nationalities were:
Rank | Origin | Applications Filed in the US (2024) |
|---|---|---|
1 | China | 153,622 |
2 | Canada | 8,664 |
3 | United Kingdom | 8,533 |
4 | South Korea | 5,977 |
5 | Germany | 4,308 |
6 | Hong Kong | 4,259 |
7 | Japan | 3,874 |
8 | Australia | 3,405 |
9 | France | 2,988 |
10 | Switzerland | 2,554 |
China is, by a wide margin, the largest source of foreign filing into the US, accounting for roughly two-thirds of all foreign-origin US applications on its own, far ahead of the next largest and less surprising source, Canada.
How that outbound volume is actually being filed
A stable, large pool of outbound filing is only half the picture; the other half is how it's getting filed. Our earlier analysis of Madrid System adoption rates found that just 4.3% of all applications filed with the USPTO in 2024 arrived via Madrid, down from 5.3% a decade earlier, meaning the overwhelming majority of the traffic covered above, both US applicants filing out and foreign applicants filing in, already moves through direct national filing rather than a single WIPO-administered application. For a firm evaluating where to build outbound and inbound US capability, that's a market where direct filing is already the norm, not the exception,
What this means in practice
US applicants remain, on balance, more domestically focused than they were a decade ago, but the US market itself is a major destination for foreign filers. For firms handling either direction of this traffic, outbound work for US clients or inbound work from foreign applicants filing into the US, Canada, the EU, Mexico, and the UK cover the largest share of outbound volume, while China dominates inbound foreign filing by a wide margin. can help size up the Madrid versus direct filing decision for any specific US-bound or US-outbound combination.
To see how the US compares to other major filing nationalities, and the aggregate trend across all of them, see the full WIPO trademark filing analysis.