Where EU filing activity actually lands
Using the WIPO Statistical Database's origin-to-destination filing matrix for 2014 to 2024, this analysis looks at:
How EU-origin applicants (aggregated across all 27 member states) split their filing between the EU and the rest of the world
How that balance has shifted over the decade
Where their outside-the-EU filings actually go
Who files into the EU system from outside it
It's part of a wider look at this same question across a dozen major filing nationalities, covered in full here, if you'd like the broader comparison alongside the EU-specific details below.
In 2024, applicants from EU member states filed 687,721 trademark applications in total, across their own national offices, EUIPO, and offices outside the EU combined. Of those, 483,914 (70.4%) stayed within the EU system, and 203,807 (29.6%) were filed outside it.
Put another way: for roughly every seven applications an EU applicant files within the EU, about three are also filed outside it, a ratio of 0.42 non-EU filings for every intra-EU one.
Has outside-the-EU filing grown, shrunk, or held steady?
The EU's intra-bloc share has climbed steadily over the decade, a genuine and fairly consistent shift.
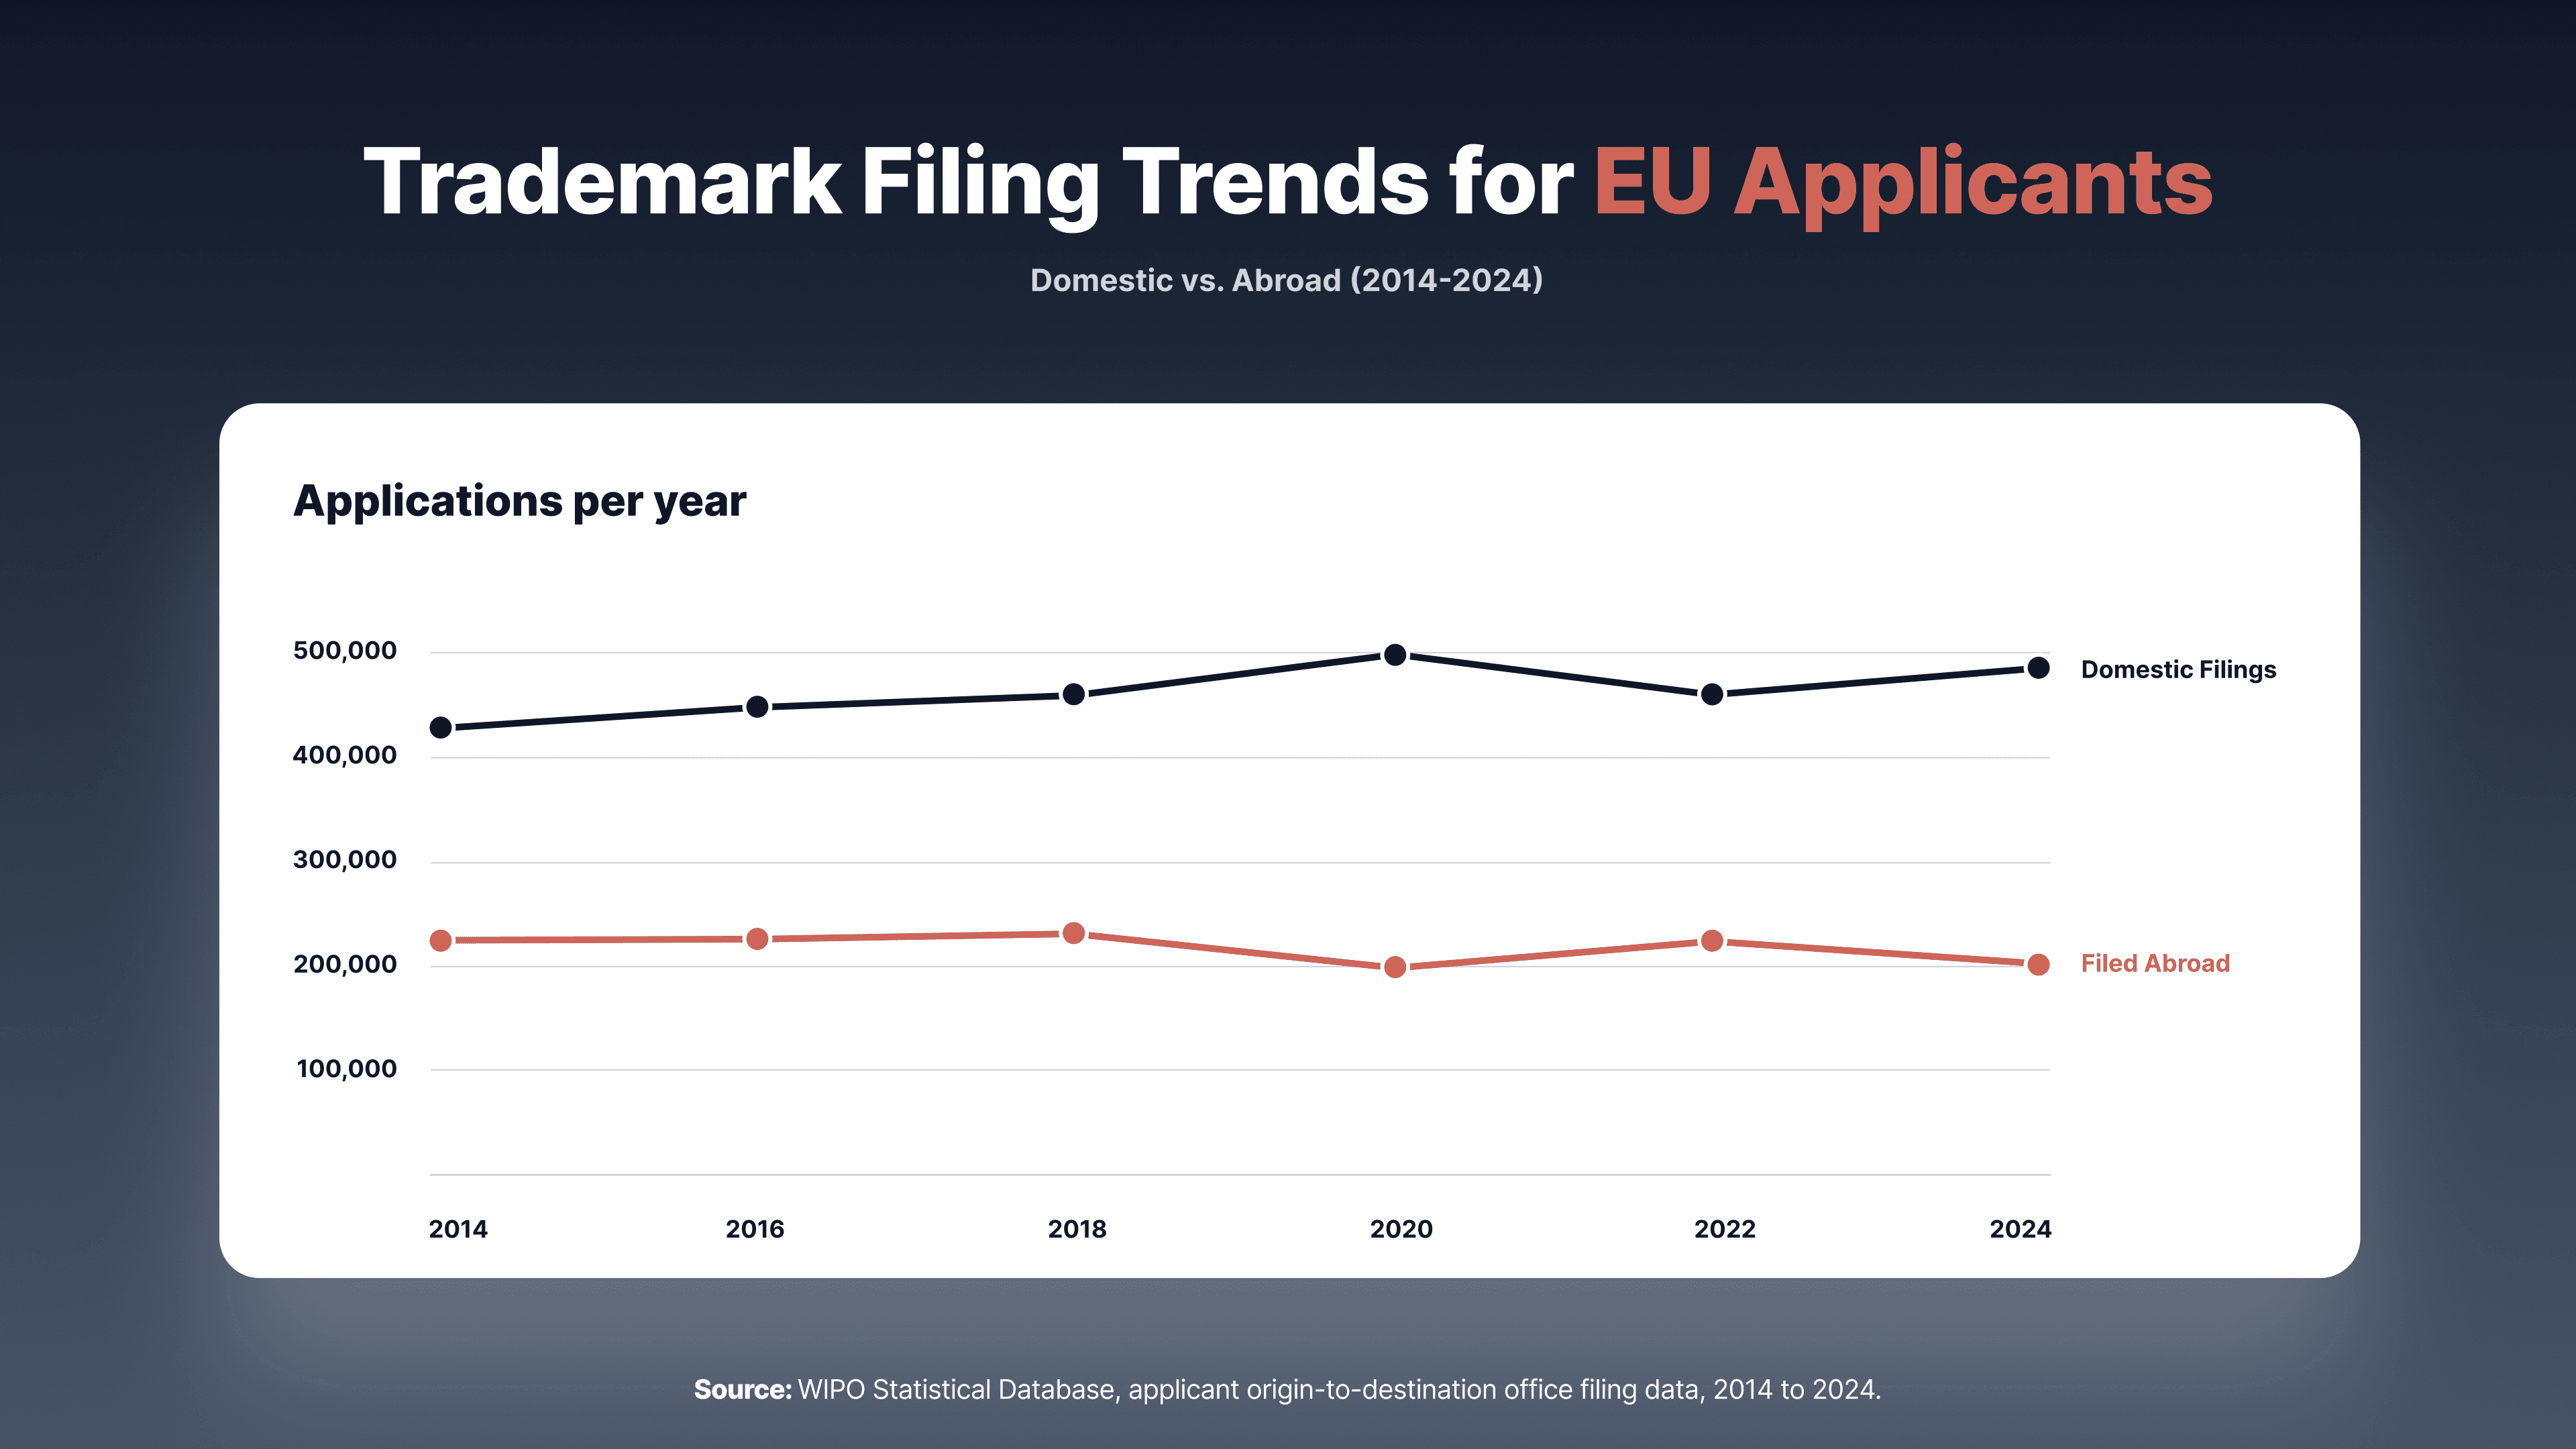
Source: WIPO Statistical Database, applicant origin-to-destination office filing data, 2014 to 2024. Intra-EU defined as filings at any of the 27 current EU member states' national offices or at EUIPO.
Intra-EU share rose from 65.6% in 2014 to 70.4% in 2024, with a notable early peak of 70.9% in 2020. Filing activity outside the EU has stayed fairly flat in absolute terms across the decade, moving in a band roughly between 203,000 and 231,000 applications a year, while intra-EU filing has grown more consistently. The direction is clear even if the path wasn't perfectly smooth: EU-origin applicants are, on the whole, keeping a larger share of their filing activity within the bloc than they did ten years ago.
Where EU applicants file once they look outside the bloc
Looking at 2024, filings from EU-origin applicants outside the EU spread across a wide set of major economies:
Rank | Destination | EU-Origin Applications Outside the EU (2024) |
|---|---|---|
1 | United States | 19,510 |
2 | United Kingdom | 18,147 |
3 | Switzerland | 11,226 |
4 | Canada | 7,333 |
5 | China | 6,852 |
6 | Mexico | 6,354 |
7 | Brazil | 6,183 |
8 | Japan | 5,770 |
9 | Norway | 5,467 |
10 | Australia | 5,021 |
Source: WIPO Statistical Database, applicant origin-to-destination office filing data, 2024.
The US and UK together account for roughly 18% of all non-EU filings from EU-origin applicants, with Switzerland a clear third. Beyond that top three, the list spreads broadly across North America, Latin America, and Asia-Pacific, without any single destination dominating the way EUIPO itself does within the bloc.
Who files into the EU system from outside it
The EU system draws a substantial amount of filing activity from applicants based entirely outside the bloc. Of the total filings received across all EU national offices and EUIPO combined in 2024, 111,053 came from non-EU-origin applicants, 18.7% of the total. The largest non-EU filer nationalities were:
Rank | Origin | Applications Filed into the EU System (2024) |
|---|---|---|
1 | China | 38,691 |
2 | United States | 21,979 |
3 | United Kingdom | 10,694 |
4 | Switzerland | 7,489 |
5 | Türkiye | 3,364 |
6 | Japan | 2,939 |
7 | South Korea | 2,923 |
8 | Hong Kong | 2,665 |
9 | Canada | 1,681 |
10 | Australia | 1,619 |
Source: WIPO Statistical Database, applicant origin-to-destination office filing data, 2024.
China is, by a wide margin, the largest non-EU filer into the EU system, more than the next two nationalities combined. The United States follows well ahead of the UK, and the remainder of the top ten spreads across a broad mix of major economies.
How that outside-the-EU filing is actually being done
A meaningful and fairly stable pool of non-EU filing is only half the picture; the other half is how it's getting filed. Our earlier analysis of Madrid System adoption rates shows Madrid usage varies considerably by individual EU member state, from roughly 2.5% in France up to over 40% in some cases, so no single bloc-wide figure captures it well. What the data does show consistently, though, is that direct filing remains the majority route for EU-origin applicants filing outside the bloc in every individual member state we've examined.
What this means in practice
The EU, treated as a single filing bloc, is a market where intra-bloc filing has grown its lead over the decade. For firms handling filing work for EU-based clients, or for non-EU clients filing into the EU system, both directions of this traffic are large and structurally stable. can help size up the Madrid versus direct filing decision for any specific EU-outbound combination.
For how EU compares to other major filing nationalities, and the aggregate trend across all of them, see the full WIPO trademark filing analysis.