
Where Australian filing activity actually lands
Using the WIPO Statistical Database's origin-to-destination filing matrix for 2014 to 2024, this analysis looks at:
How Australian-origin applicants split their filing between home and abroad
How that balance has shifted over the decade
Where their outbound filings actually go
Who files into Australia from abroad
It's part of a wider look at this same question across a dozen major filing nationalities, covered in full here, if you'd like the broader comparison alongside the Australian-specific detail below.
In 2024, Australian-origin applicants filed 66,004 trademark applications worldwide. Of those, 48,558 (73.6%) were filed only with IP Australia, and 17,446 (26.4%) were filed abroad.
Put another way: for roughly every three applications an Australian applicant files at home, about one is also filed abroad, a ratio of 0.36 international filings for every domestic one.
Has outbound volume grown, shrunk, or held steady?
Australia's domestic-versus-abroad split has stayed in a fairly tight range for the entire decade, without a clear multi-year climb or decline in either direction.
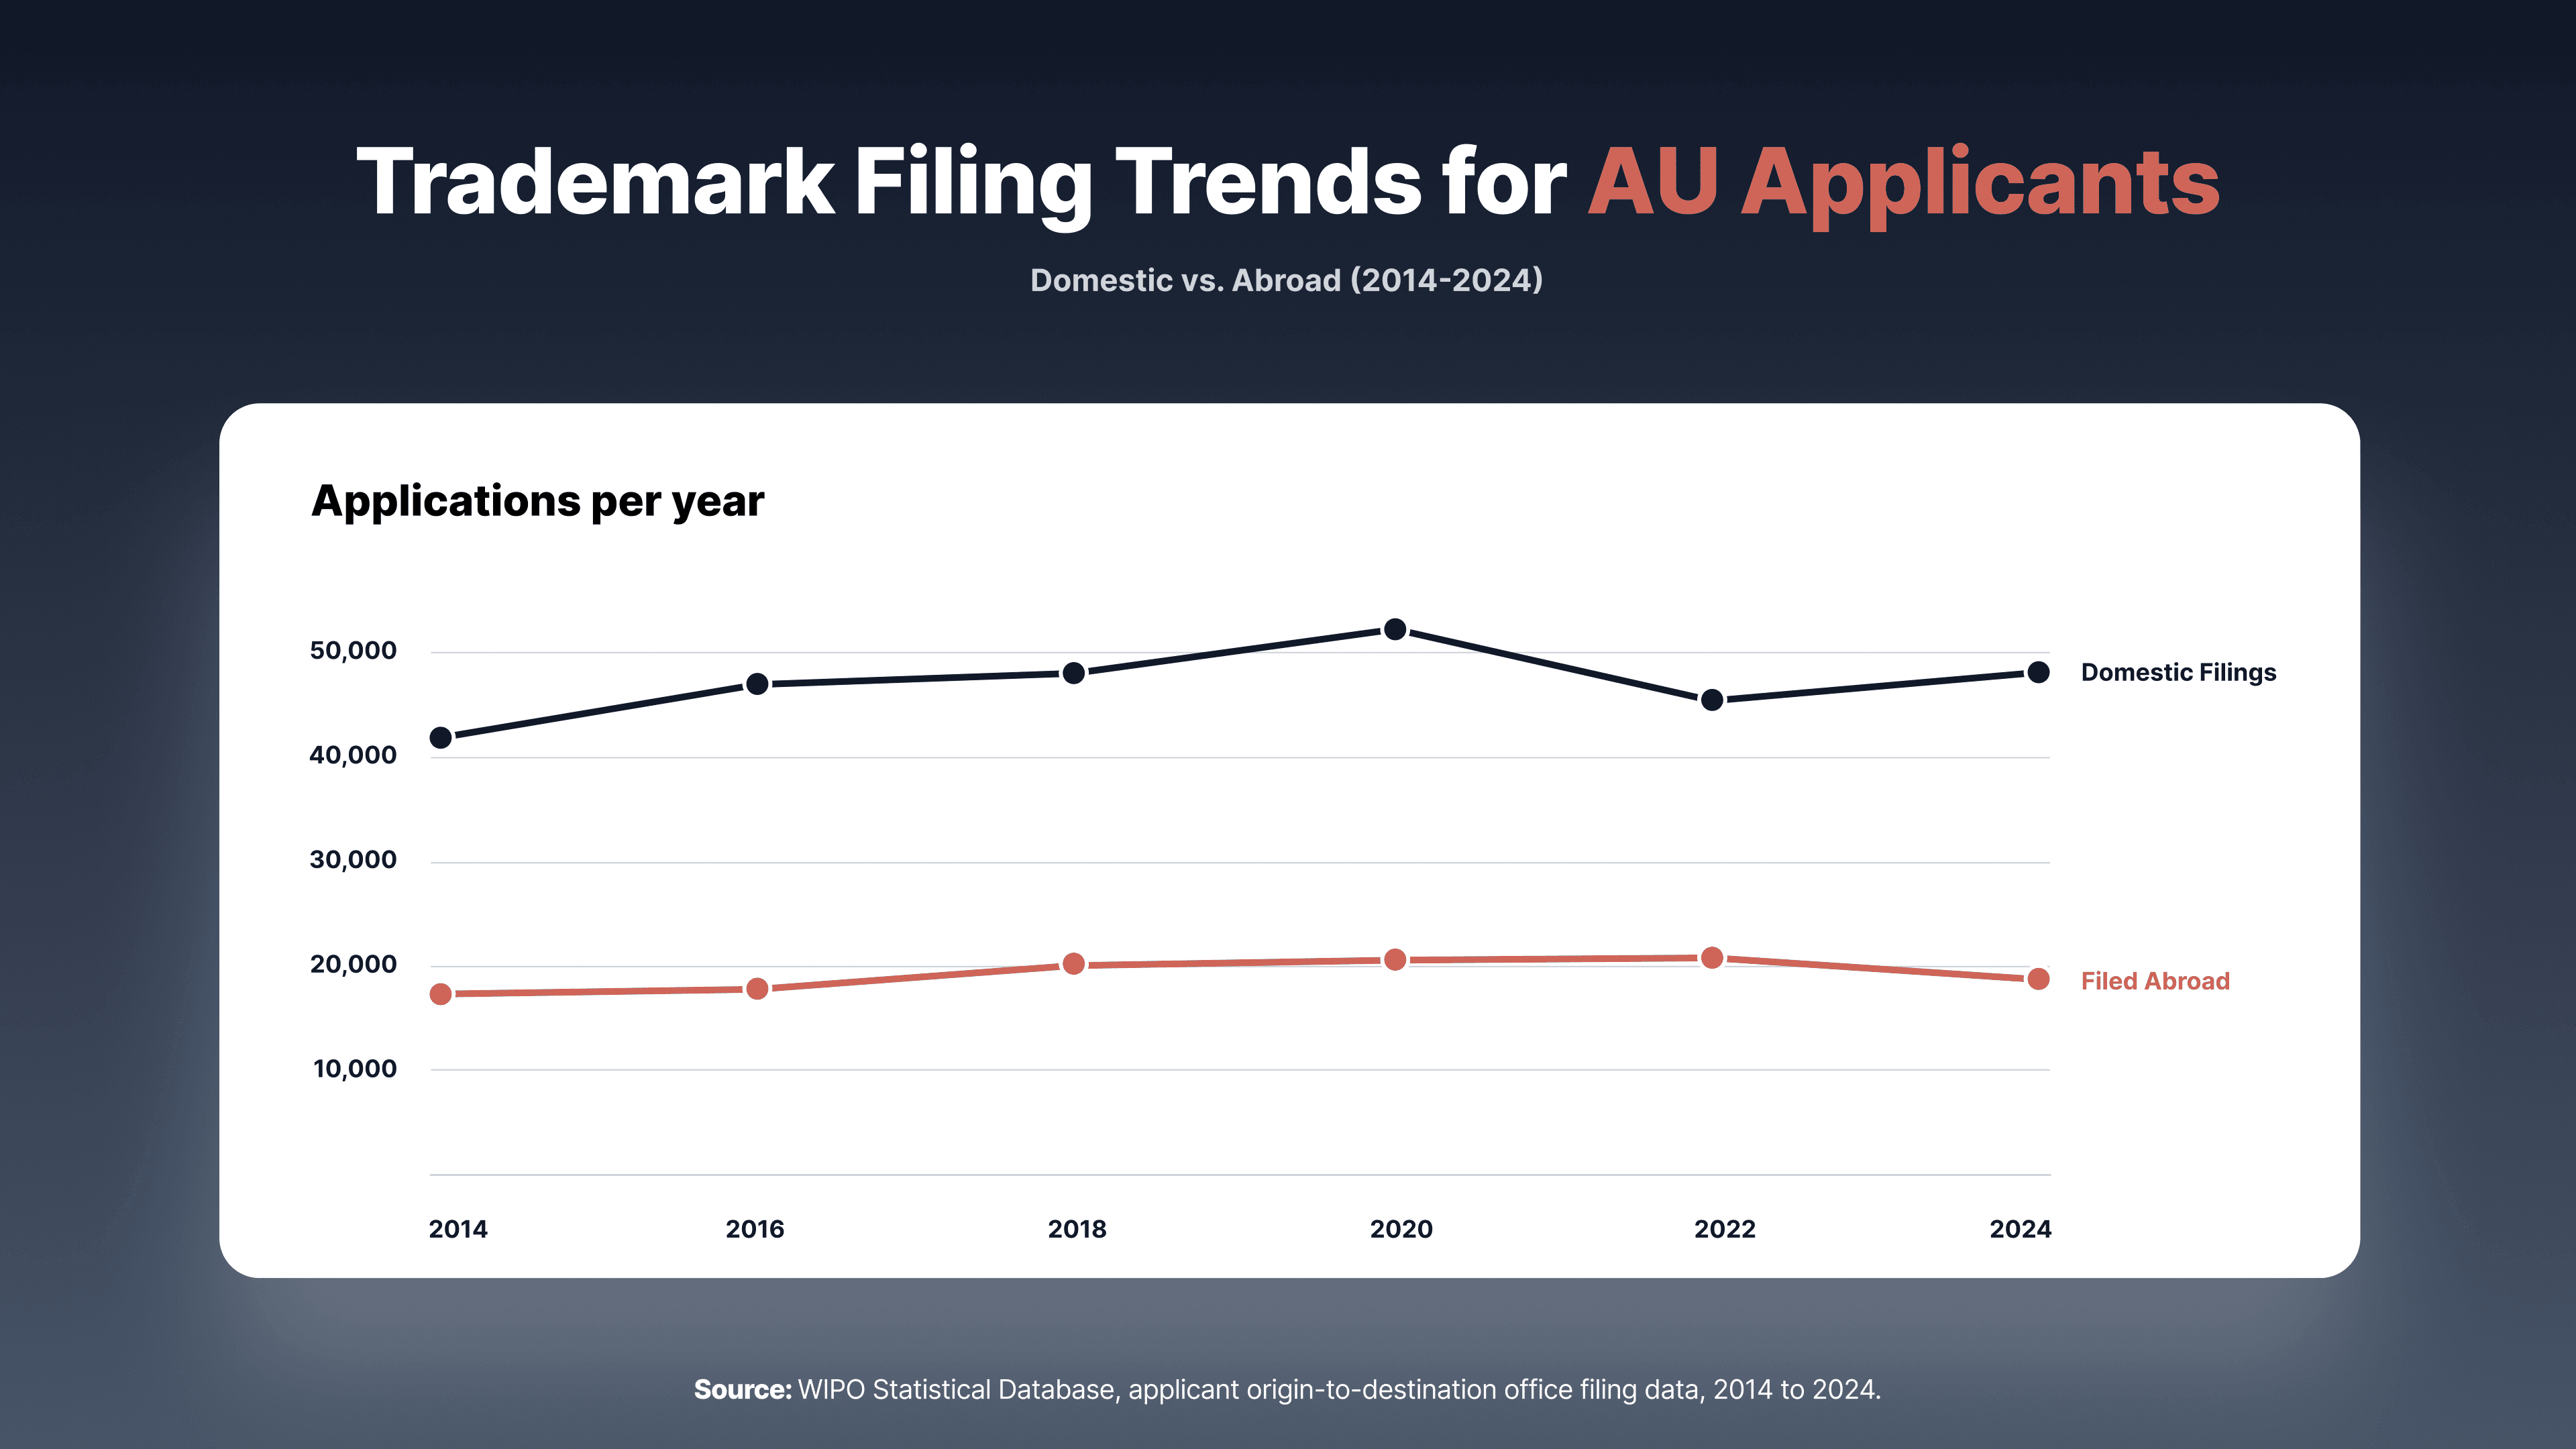
Source: WIPO Statistical Database, applicant origin-to-destination office filing data, 2014 to 2024.
Domestic share has moved within a narrow band across the entire period, never dropping below 68% or rising much past 74%. 2022 stands out as the year closest to an even balance, with domestic share dipping to 68.4% and outbound filing reaching its highest volume in the dataset at 20,665 applications. The overall picture is one of stability around a roughly three-to-one domestic-to-abroad split, with individual years moving around that midpoint rather than trending firmly toward either side.
Where Australian applicants actually file abroad
Looking at 2024, Australian outbound filings spread across a broader mix of destinations than a single dominant one:
Rank | Destination | Australian-Origin Applications (2024) |
|---|---|---|
1 | United States | 3,405 |
2 | New Zealand | 2,638 |
3 | United Kingdom | 1,645 |
4 | European Union (EUIPO) | 1,279 |
5 | Canada | 895 |
6 | Singapore | 552 |
7 | China | 520 |
8 | India | 512 |
9 | Japan | 506 |
10 | South Korea | 408 |
The US leads, but not by the overwhelming margin seen for a single dominant destination in some other markets, accounting for roughly a fifth of all Australian outbound filings. New Zealand's second-place position stands out as a distinctly regional pattern, reflecting the closeness of the trans-Tasman business relationship, and the rest of the top ten spreads across a genuine mix of English-speaking, European, and Asia-Pacific markets rather than clustering around one bloc.
Who files into Australia from abroad
Australia draws a substantial amount of foreign filing activity relative to its own domestic volume. Of the 85,186 total applications filed with IP Australia in 2024, 36,628 (43.0%) came from applicants based outside Australia, well over a third of all Australian filing activity. The largest foreign filer nationalities were:
Rank | Origin | Applications Filed in Australia (2024) |
|---|---|---|
1 | China | 11,909 |
2 | United States | 8,656 |
3 | United Kingdom | 2,264 |
4 | Germany | 1,297 |
5 | New Zealand | 1,210 |
6 | Japan | 1,050 |
7 | South Korea | 940 |
8 | Hong Kong | 918 |
9 | Switzerland | 917 |
10 | France | 864 |
China and the United States together account for well over half of all foreign filing into Australia. The scale of foreign interest here, over four in ten of all applications filed with IP Australia, is substantial for a market of Australia's size, reflecting its role as a significant, English-speaking gateway market in the Asia-Pacific region.
How that outbound volume is actually being filed
A stable pool of outbound filing is only half the picture; the other half is how it's getting filed. Our earlier analysis of Madrid System adoption rates found that the share of total Australian filing activity arriving via Madrid moved only modestly over the same period, from 18.1% in 2014 to 18.4% in 2024, with a temporary peak of 22.7% in 2022. Even at its highest point, more than three-quarters of Australian filing activity bypassed Madrid, and direct filing has remained the clear default throughout.
What this means in practice
Australia is a market with a consistent, roughly three-to-one domestic-to-abroad split, an outbound filing pattern that spreads across the US, New Zealand, the UK, and the EU rather than concentrating on one destination, and a substantial inbound foreign filing base led decisively by China and the United States.
For firms handling outbound work for Australian clients, the destination list is genuinely diversified rather than dominated by a single market, and direct filing remains the strong majority route even where Madrid sees modest use. Trama's WIPO cost and risk calculator can help size up the Madrid versus direct filing decision for any specific Australia-outbound combination.
For how Australia compares to other major filing nationalities, and the aggregate trend across all of them, see the full WIPO trademark filing analysis.